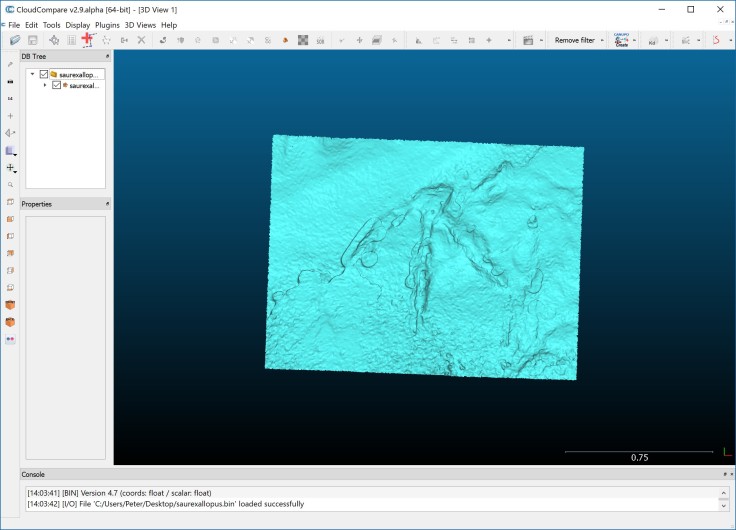
Import
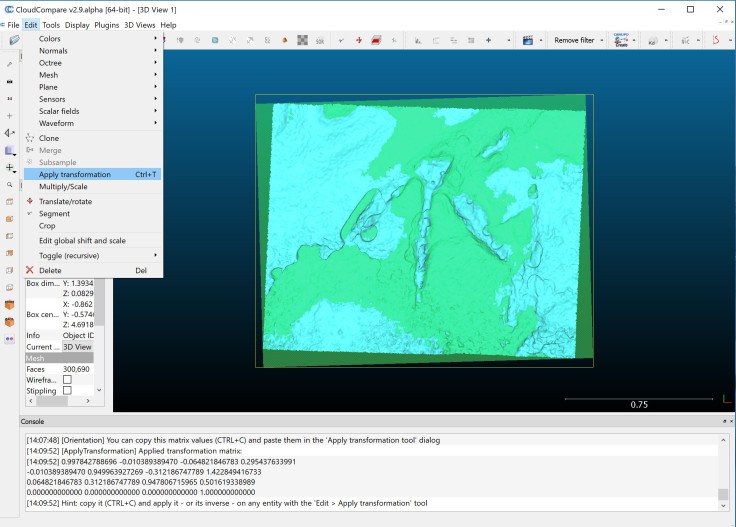
Align to plane.
Note: I’ve gone back and forth over the years about how accurate this should be – you might want to cut out an area around the foot of undisturbed sediment surface and base the horizontal on that, but to be honest, from experience it seems that just fitting a plane to the whole thing is ‘good enough’


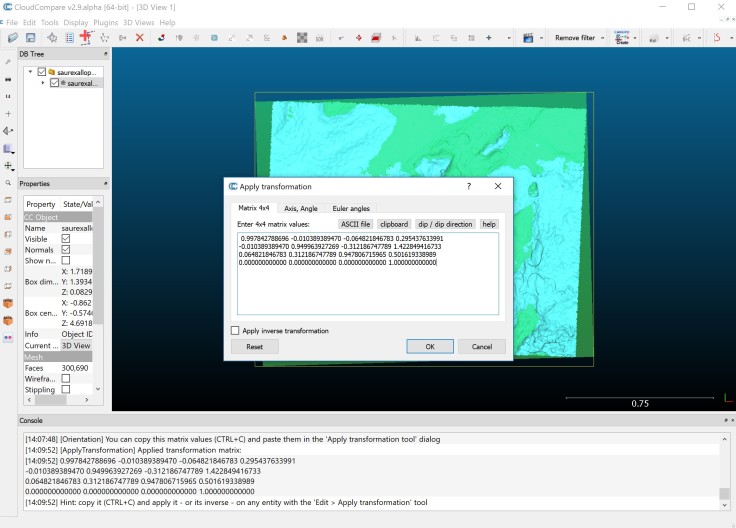
This fits a plane (adding it to the DB Tree on the left), and in the Console describes the position of that plane (including translations and rotations). We will use this to transform the original object to the horizontal:
You can then check that it’s right by using the buttons on the left to view the object in 4 planar orientations:

Colorizing by height:
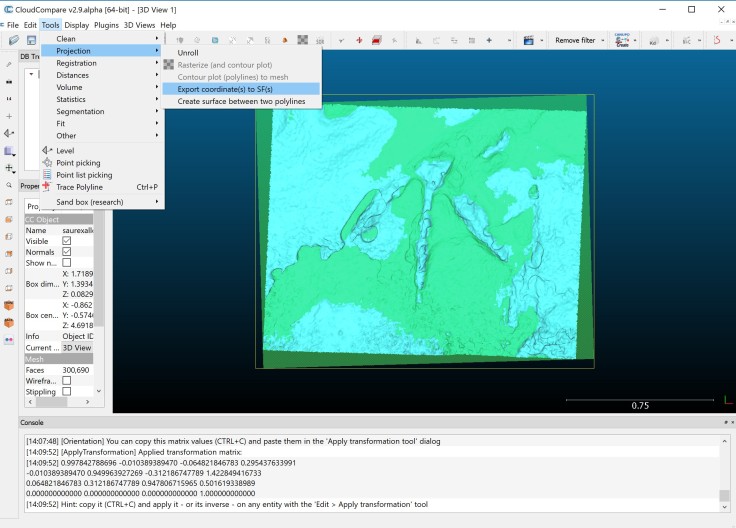
To explain what’s happening here, consider that every point in a point cloud, or every vertex in a mesh has an x, y, and z coordinate (and possible a Red, Green, Blue colour value, and maybe a x, y, z normal value). This function creates a new value for each point and copies the Z-coordinate into it. Cloud Compare will ask which coordinate you want to export, and if you’ve been following along, you’ll want to select ‘Z’:

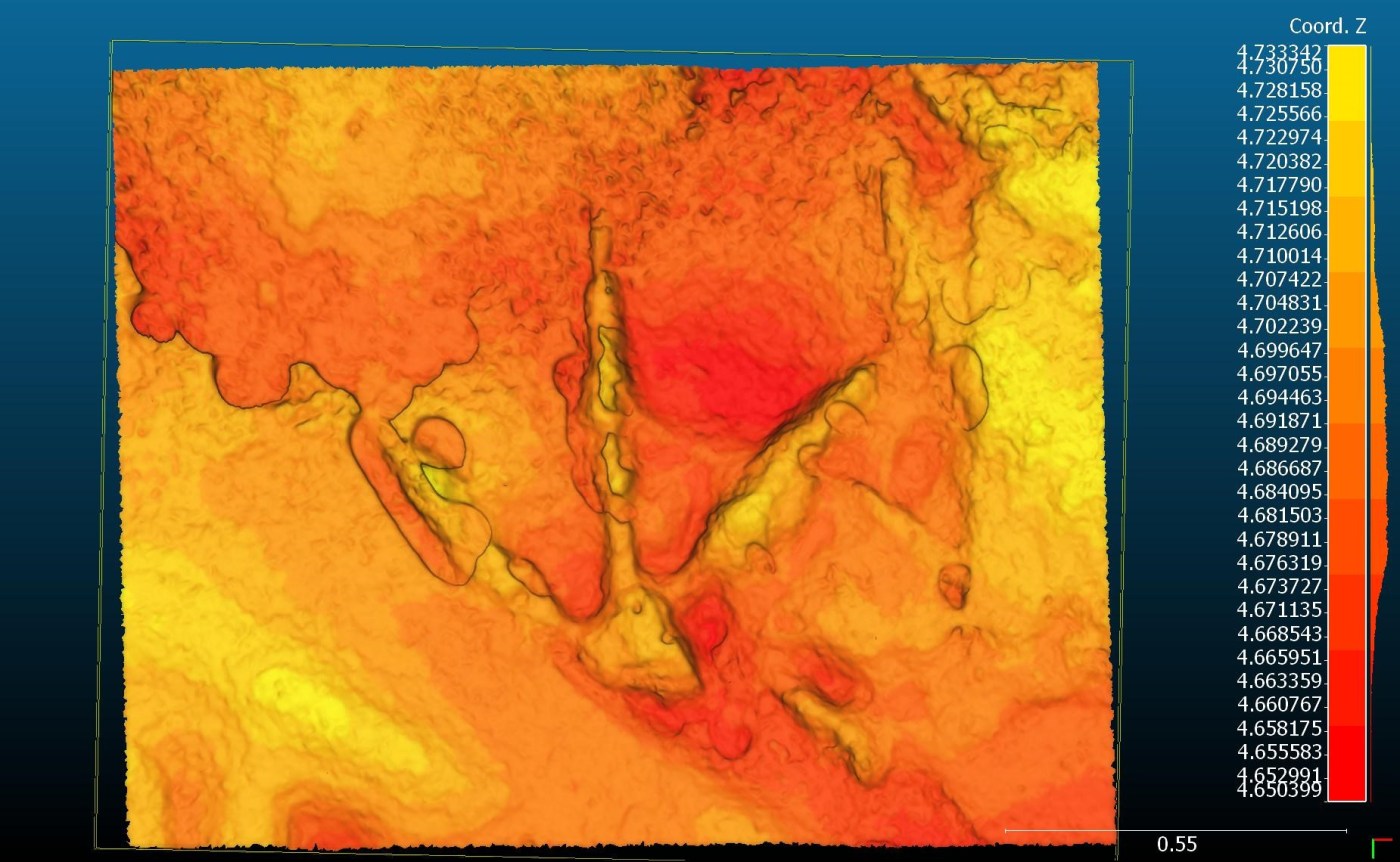
Dada! One height-mapped footprint:

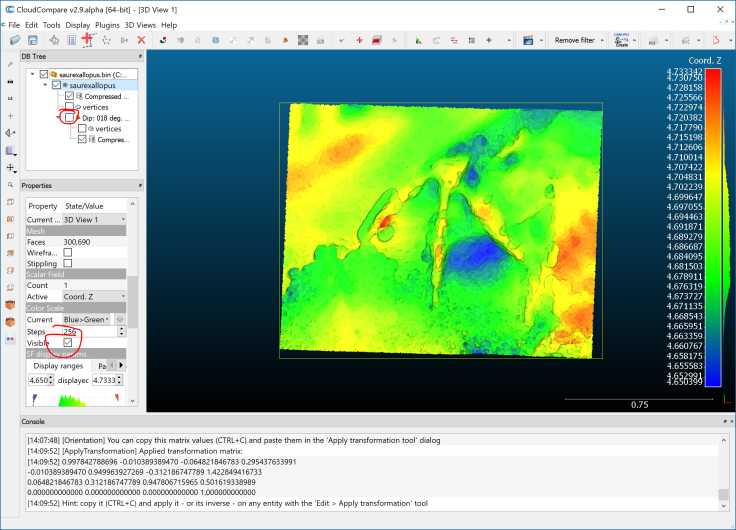
Your scale bar on the right should be in whatever units your model is in, and handily includes a histogram of frequency, so you can see how many points/vertices are above or below the level of the plane. Note that here, the plane still isn’t lying at 0. To set the plane to 0, I’d just need to translate the footprint by -4.68 in the Z direction.
You can use other options in the SF Display Params on the left to change number of colour steps, or the range of colour etc:

You can then save images with Display->Render to File

*Please note that if you use CloudCompare commercially, or if a laser scanner company tries to fob it off on you instead of providing their own software, please support the developer. Also: make sure to read this thread to see how to properly cite CloudCompare if you use it to generate figures for papers/talks/posters etc.
